


GSC Chart
GSC tracks the considerable growth in both impressions and clicks over the past year. This really started growing fast a few months into the campaign
ISS Automotive is an online D2C brand for instrument clusters and replacement electronic car parts.
Become the biggest online store for instrument cluster repairs and replacements in organic search.
Instrument Cluster Store 😊
Circuit Board Medics 😊
CarParts.com 😒

Users
Monthly Users
Assisted Conversions
Annual Revenue
Top 3 Keywords
Page 1 Keywords
No two projects are the same, but the high level strategy never changes. Here are the 3 steps we use every time to multiply our clients organic revenue, along with the specific tactics we used for this client campaign.
Every campaign begins with improving the overall site quality. Why work on one page, when we can impact every page with a single change.
For ISS, there were actually very few issues here to begin with.
The main two issues were the standard Shopify SEO problems.
Firstly, every product was linked to canonicalised URLs containing the collection handle.
So if you were on the instrument cluster replacement collection and clicked a product, it’d take you to this long URL:
/collections/instrument-cluster-replacementRather than directly to the correct product URL:
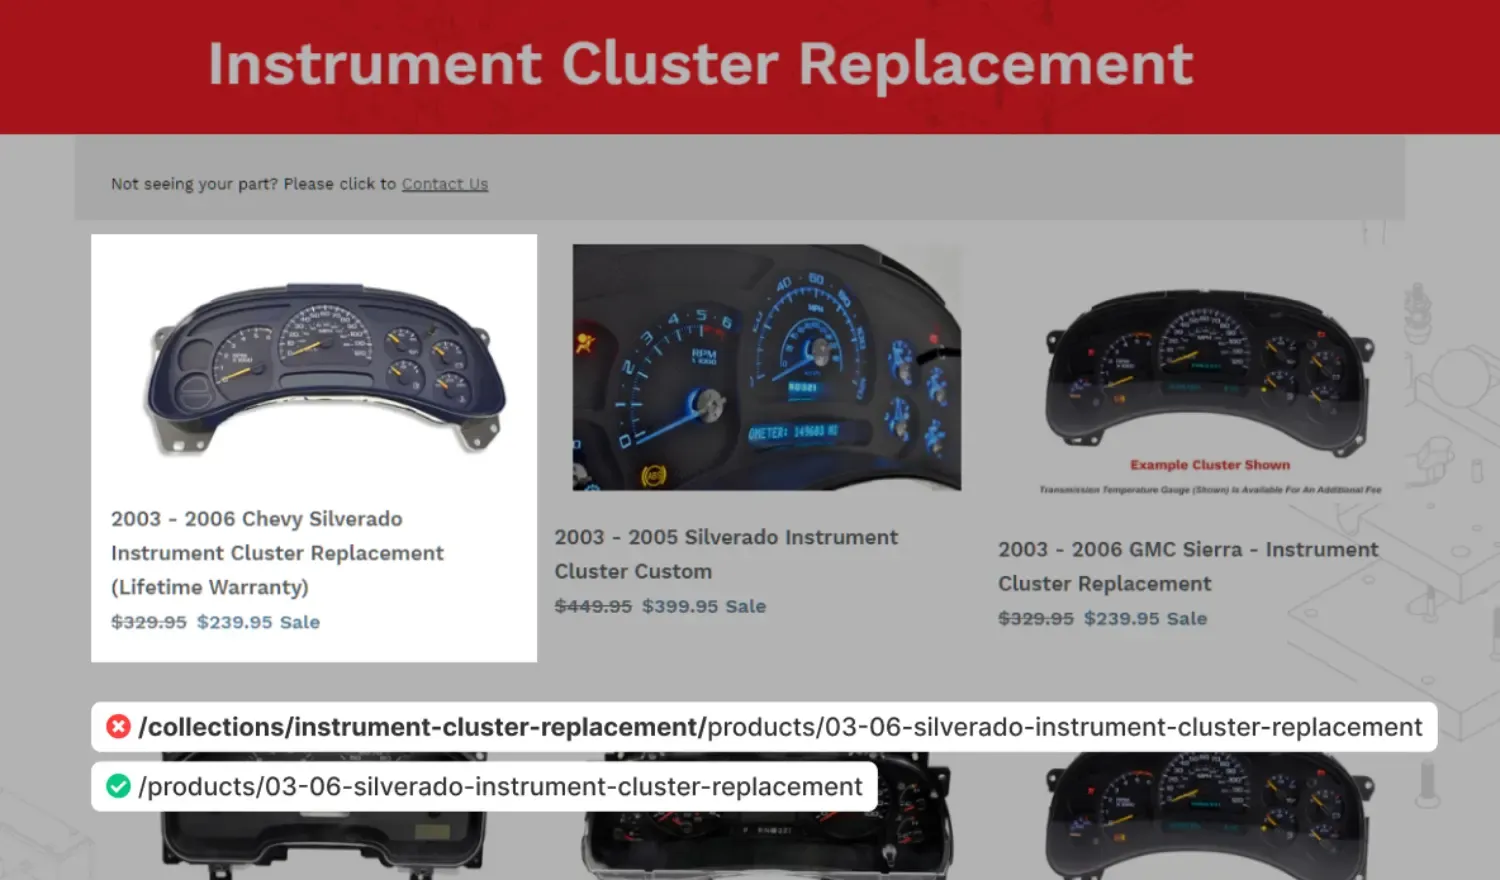
This causes a mess with indexing the right pages and passing the benefit of internal links.
Alongside that, all the tag pages Shopify automatically created were still indexable. So any time a tag was created for blog posts or products, that automatically created a new page.
This creates a lot of low quality pages which impact the site quality level.
Thankfully, it’s pretty easy to fix this by noindexing them.
Besides this, there were just your basic SEO fixes like 404 pages, redirect chains, etc. Standard things that happen to sites with a lot of pages and around for a while.
This is where the campaign gets much more exciting.
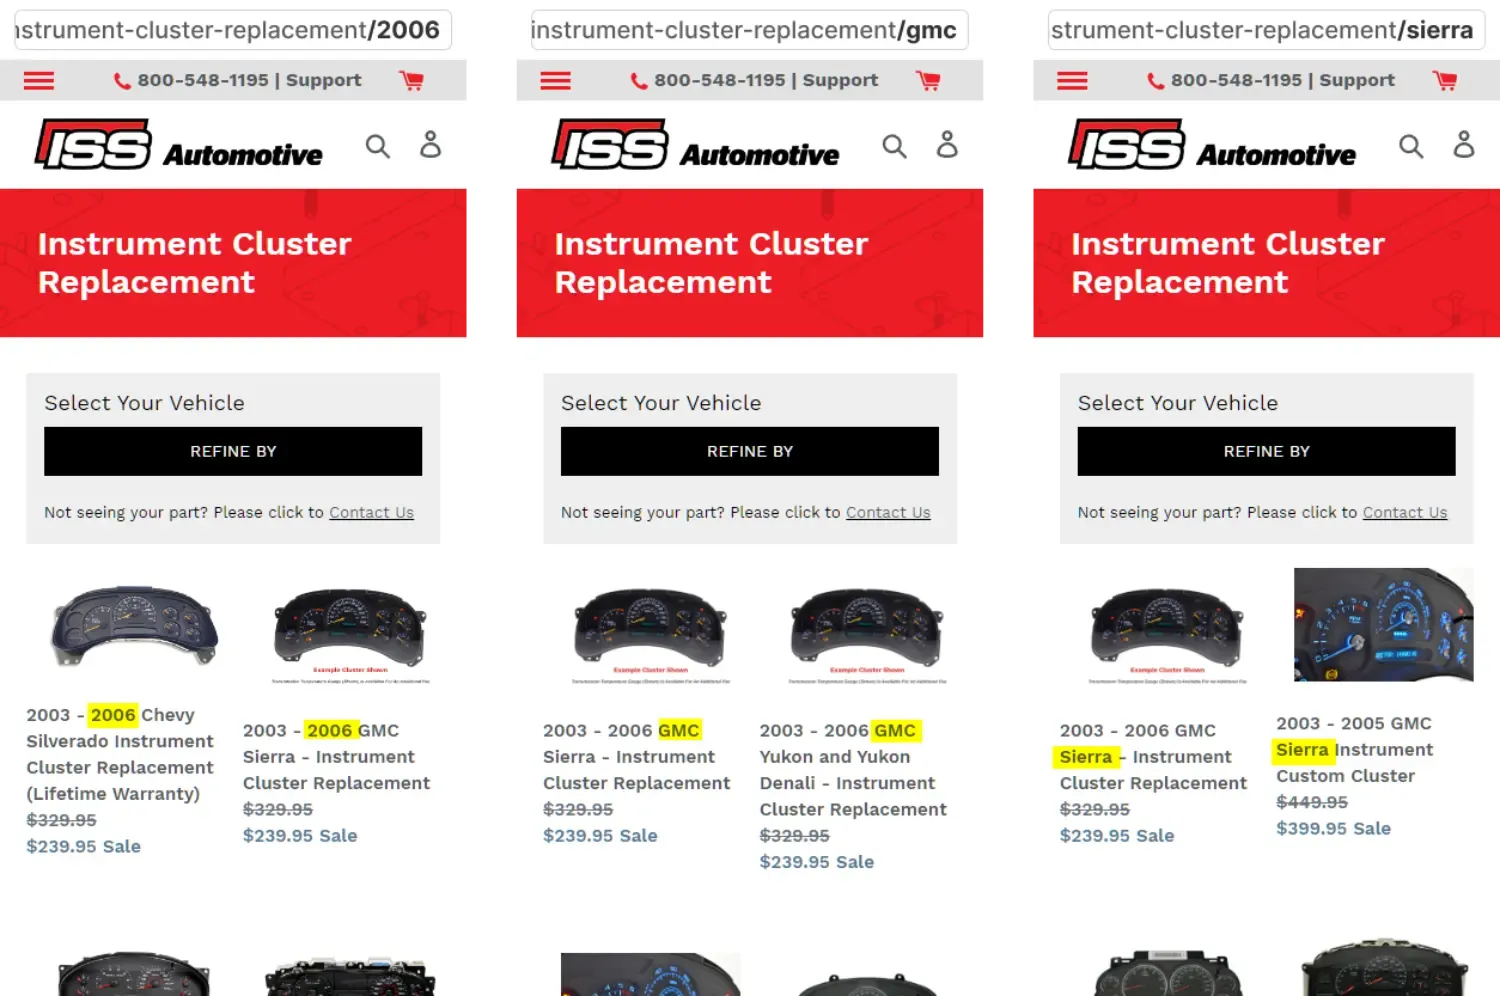
ISS Automotive sells instrument clusters and other vehicle electronics. If you look at how their site was set up, you’d see they did an excellent job of breaking this down by year and model.
See this example:
This brought in some great traffic for someone searching say Chevy Silverado Instrument Cluster or for 2003 Chevy Silverado Instrument Cluster.
But what if someone searched for 2004? Or 2005?
From a user navigational perspective, they had this great search feature:
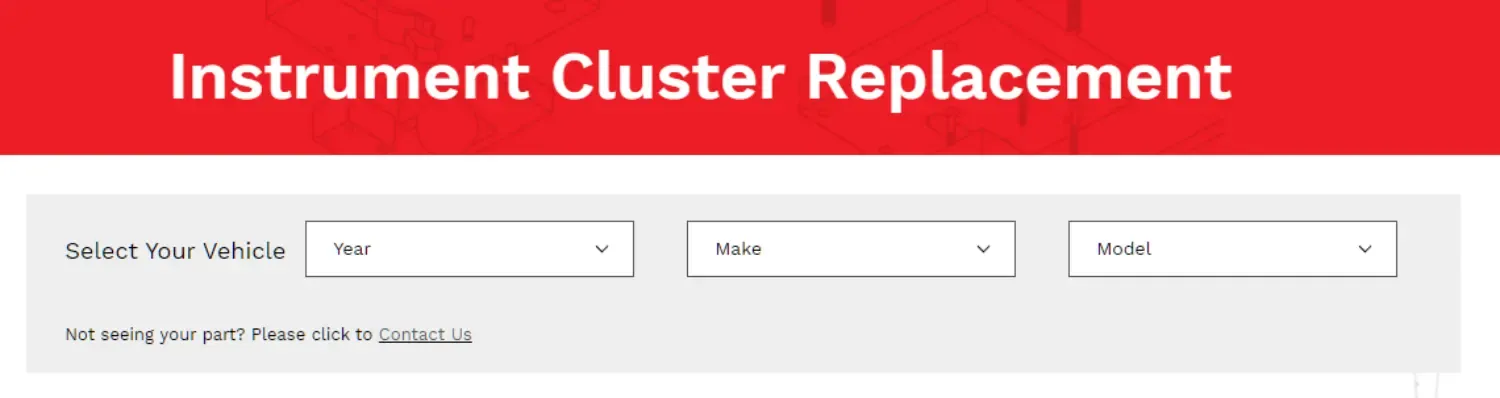
But from a search engine perspective, there was no page optimised for these specific years. And these searches are hyper specific to their products, if you search this, it’s highly likely you’re going to buy it.
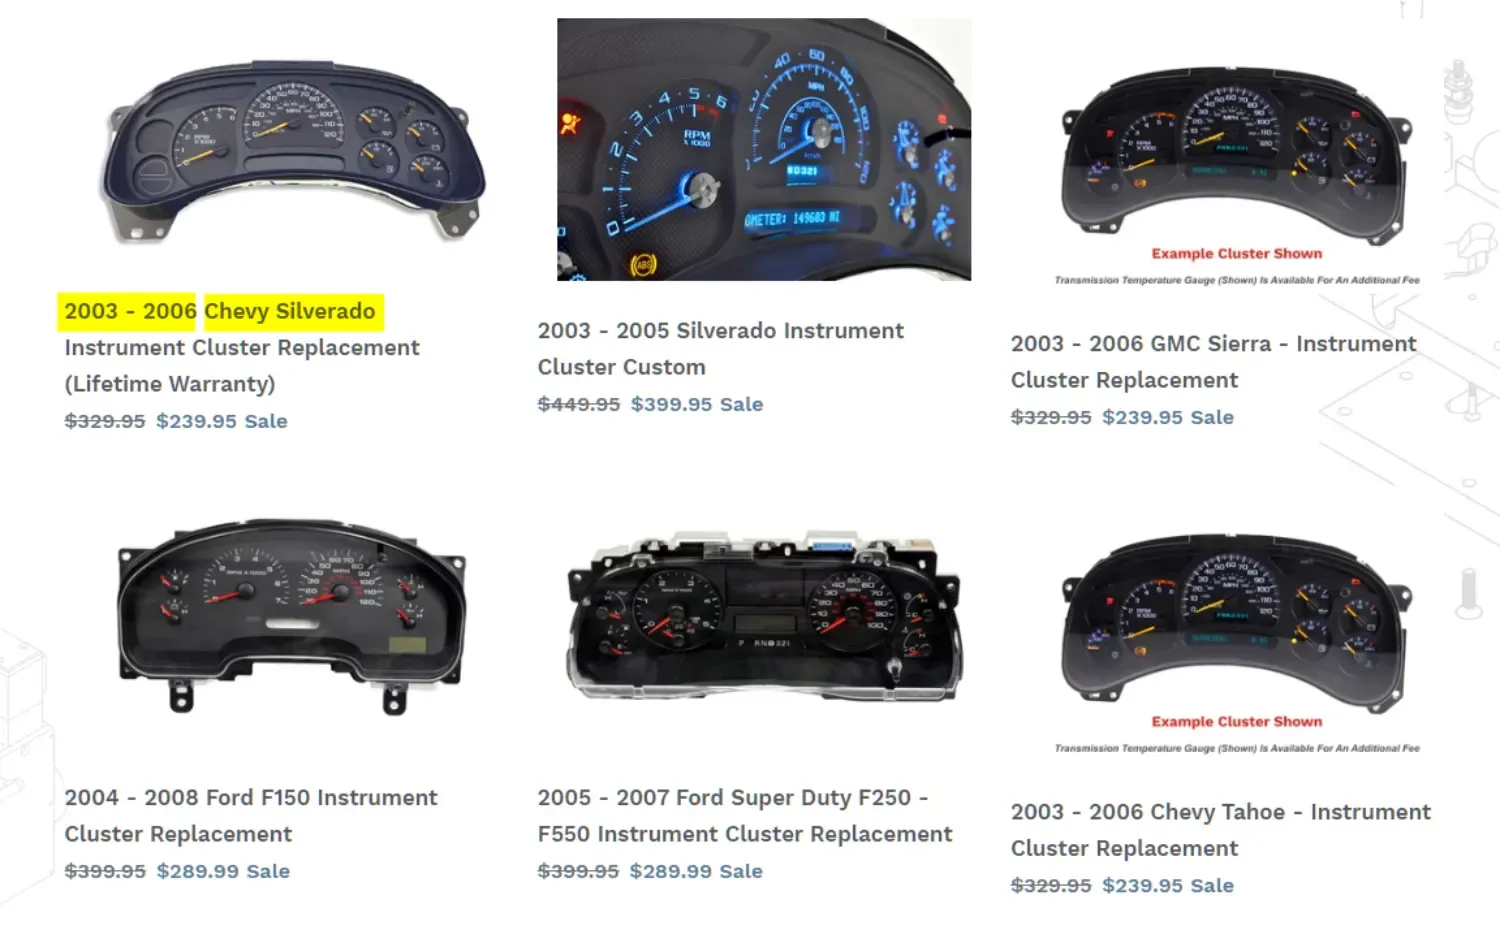
So we created product pages for each of these:
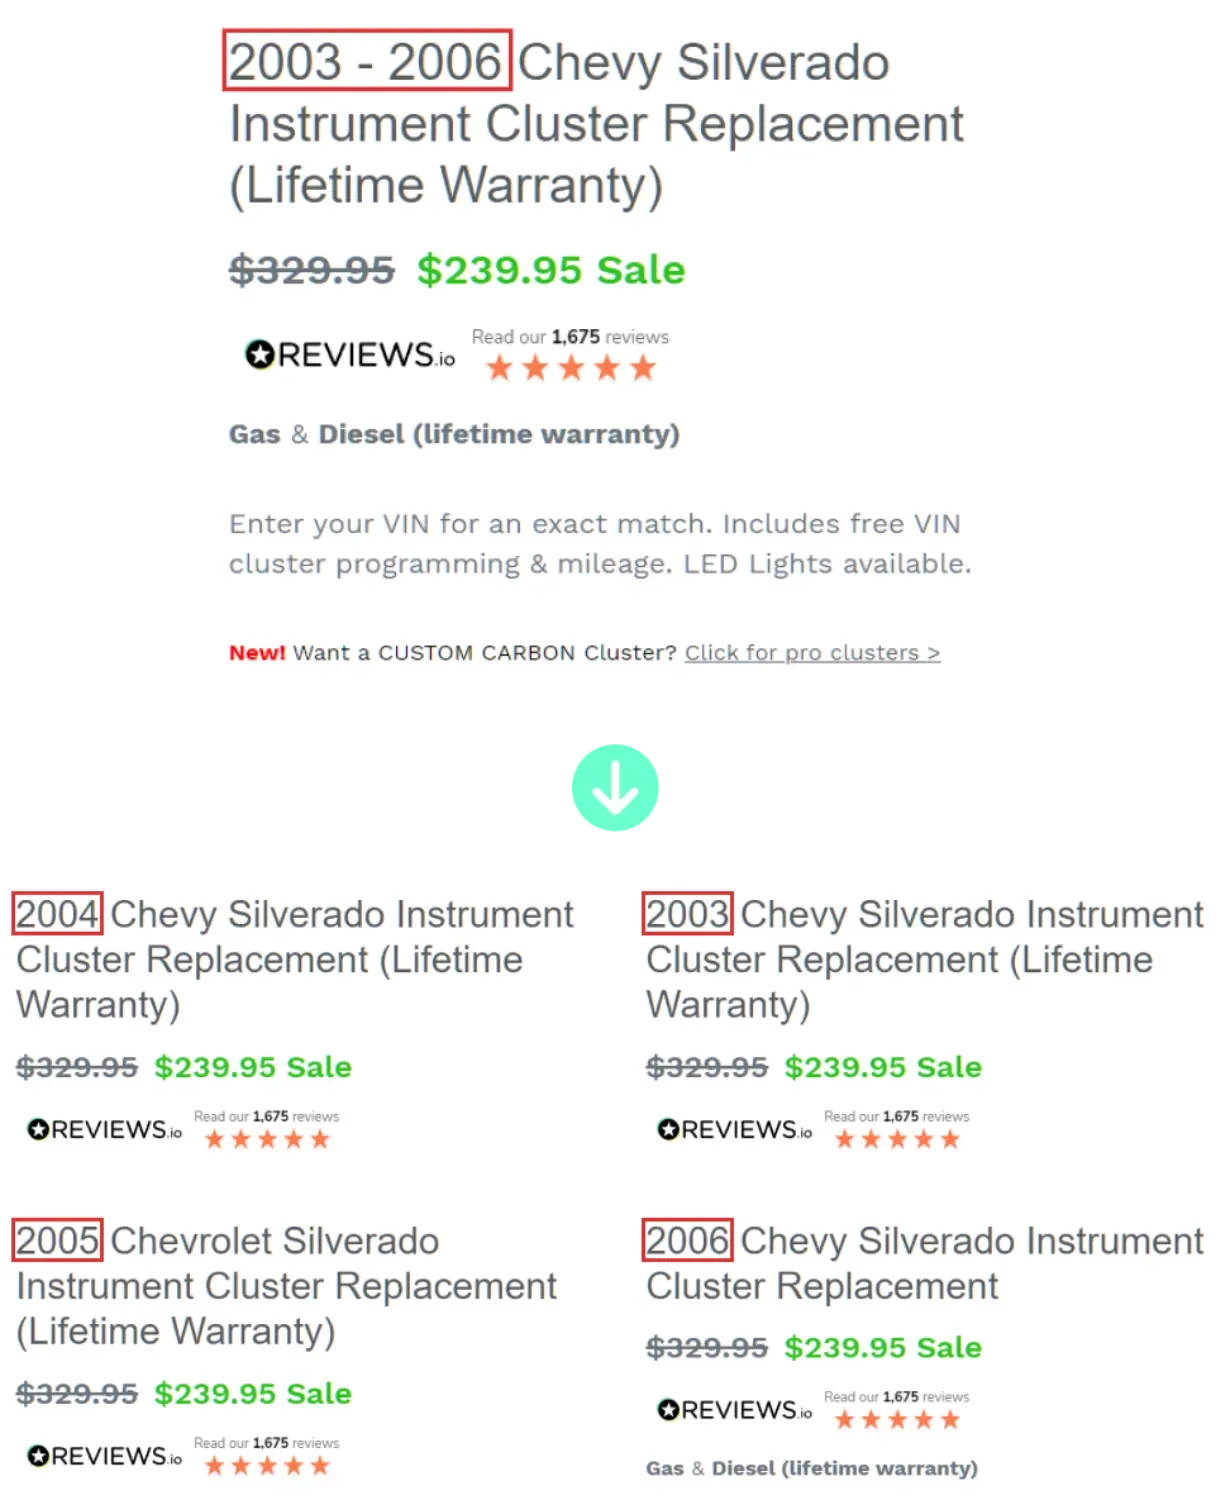
And despite little to no search volume according to SEO data tools, these pages almost immediately started getting traffic and driving revenue. They also performed amazingly in Google Shopping Ads, though not our area of expertise.
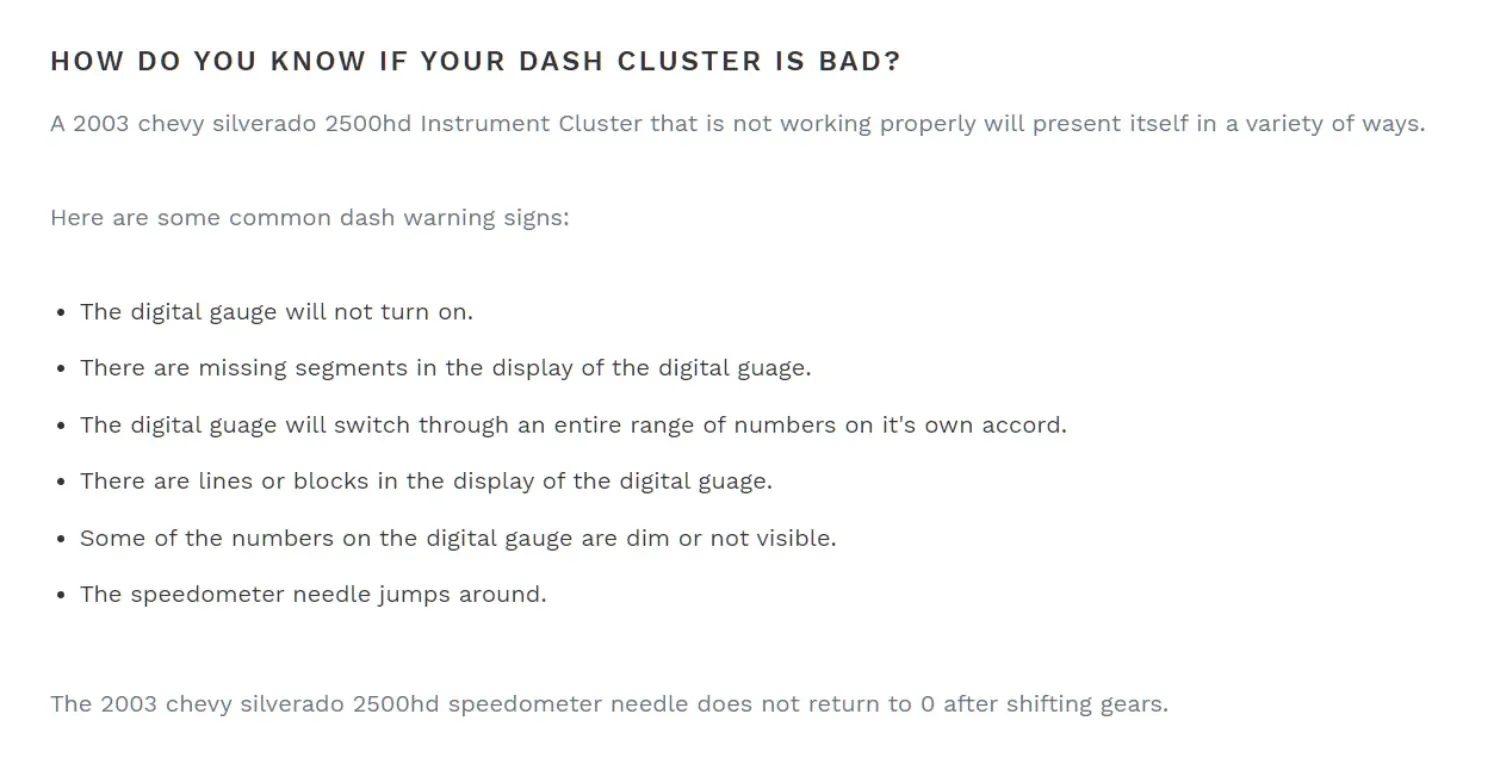
On top of bottom of funnel, we also helped ISS publish a lot of content.
Take their throttle controller product, who buys this? Well yes, someone searching for a* throttle controller***.*
But how about one of 2,200 searches per month for “car won’t accelerate”? Which they’re ranking #1 for.
Or how about “Acura MDX Acceleration Problem”? Or the various other models they cover.
At this point, we’ve helped ISS Automotive publish well over 100 blog posts, hence the huge rise in traffic:
The final key stage is to optimise and improve the bottom of funnel. Having the right pages in place is one thing, but they need to be great pages designed to rank.
That meant adding more content such as FAQs to the product page descriptions:
Internal linking relevant product pages:
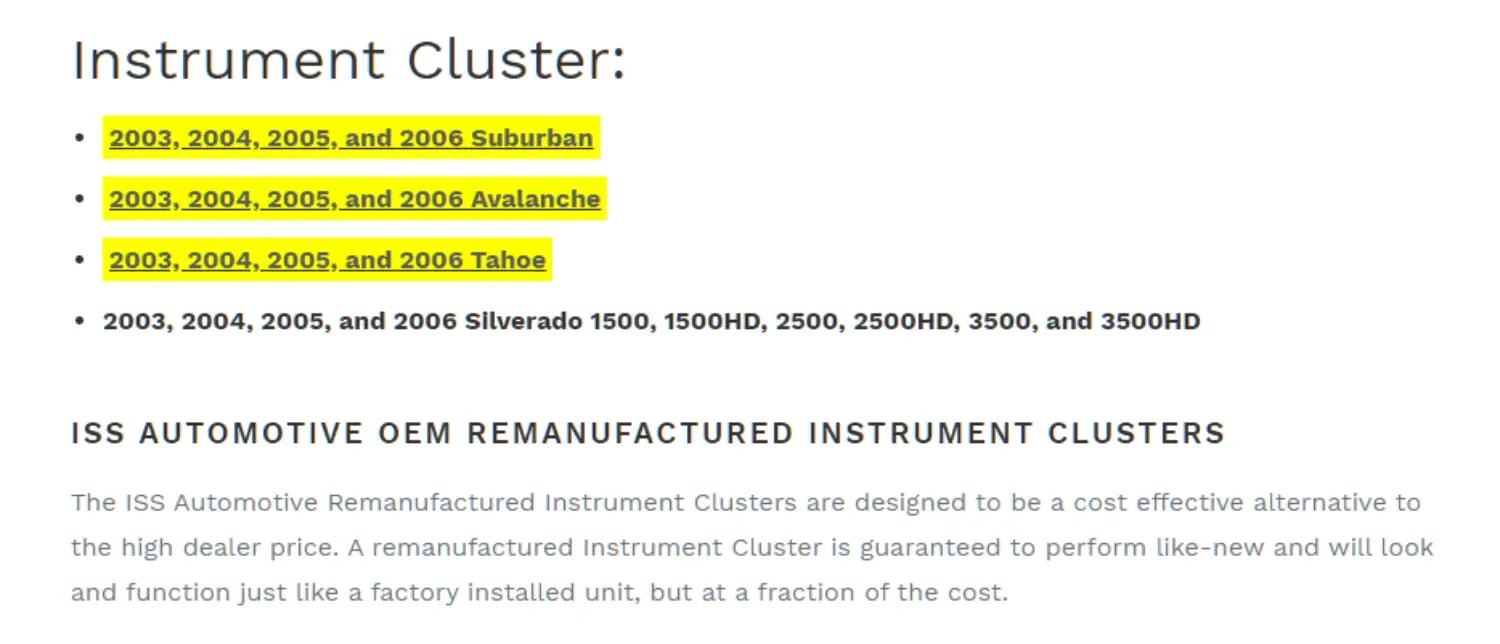
And all the other fundamentals including optimising the H1s (product/collection names), SEO title tag, meta descriptions, etc.
This adds up a lot when there’s 100+ products to rank.
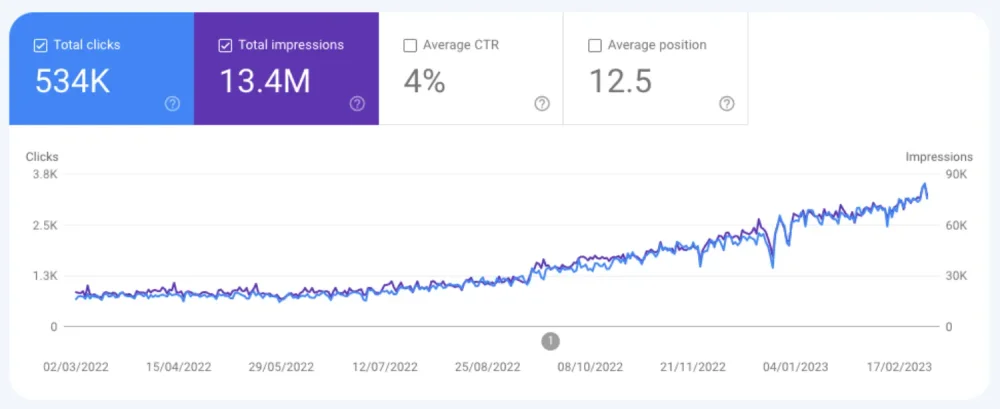
GSC tracks the considerable growth in both impressions and clicks over the past year. This really started growing fast a few months into the campaign
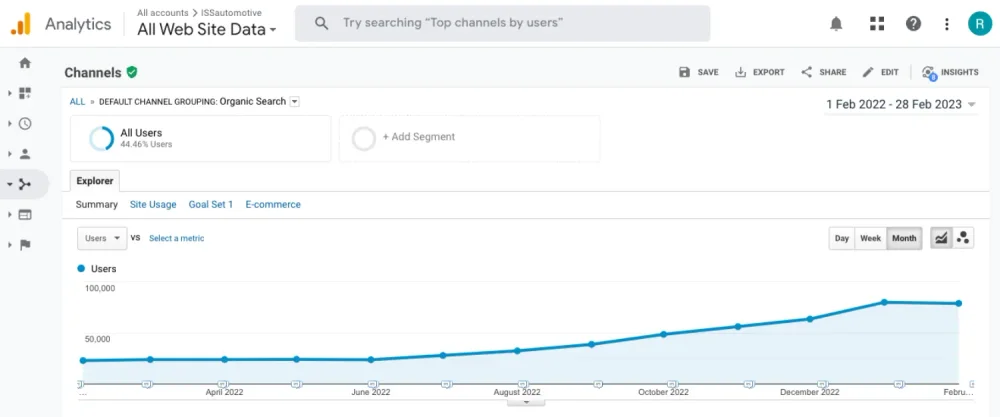
GA shows how this directly translated into significant traffic growth now multiple times the starting point. This shows a standard trajectory with SEO with the initial months slow while changes are made, then huge growth later

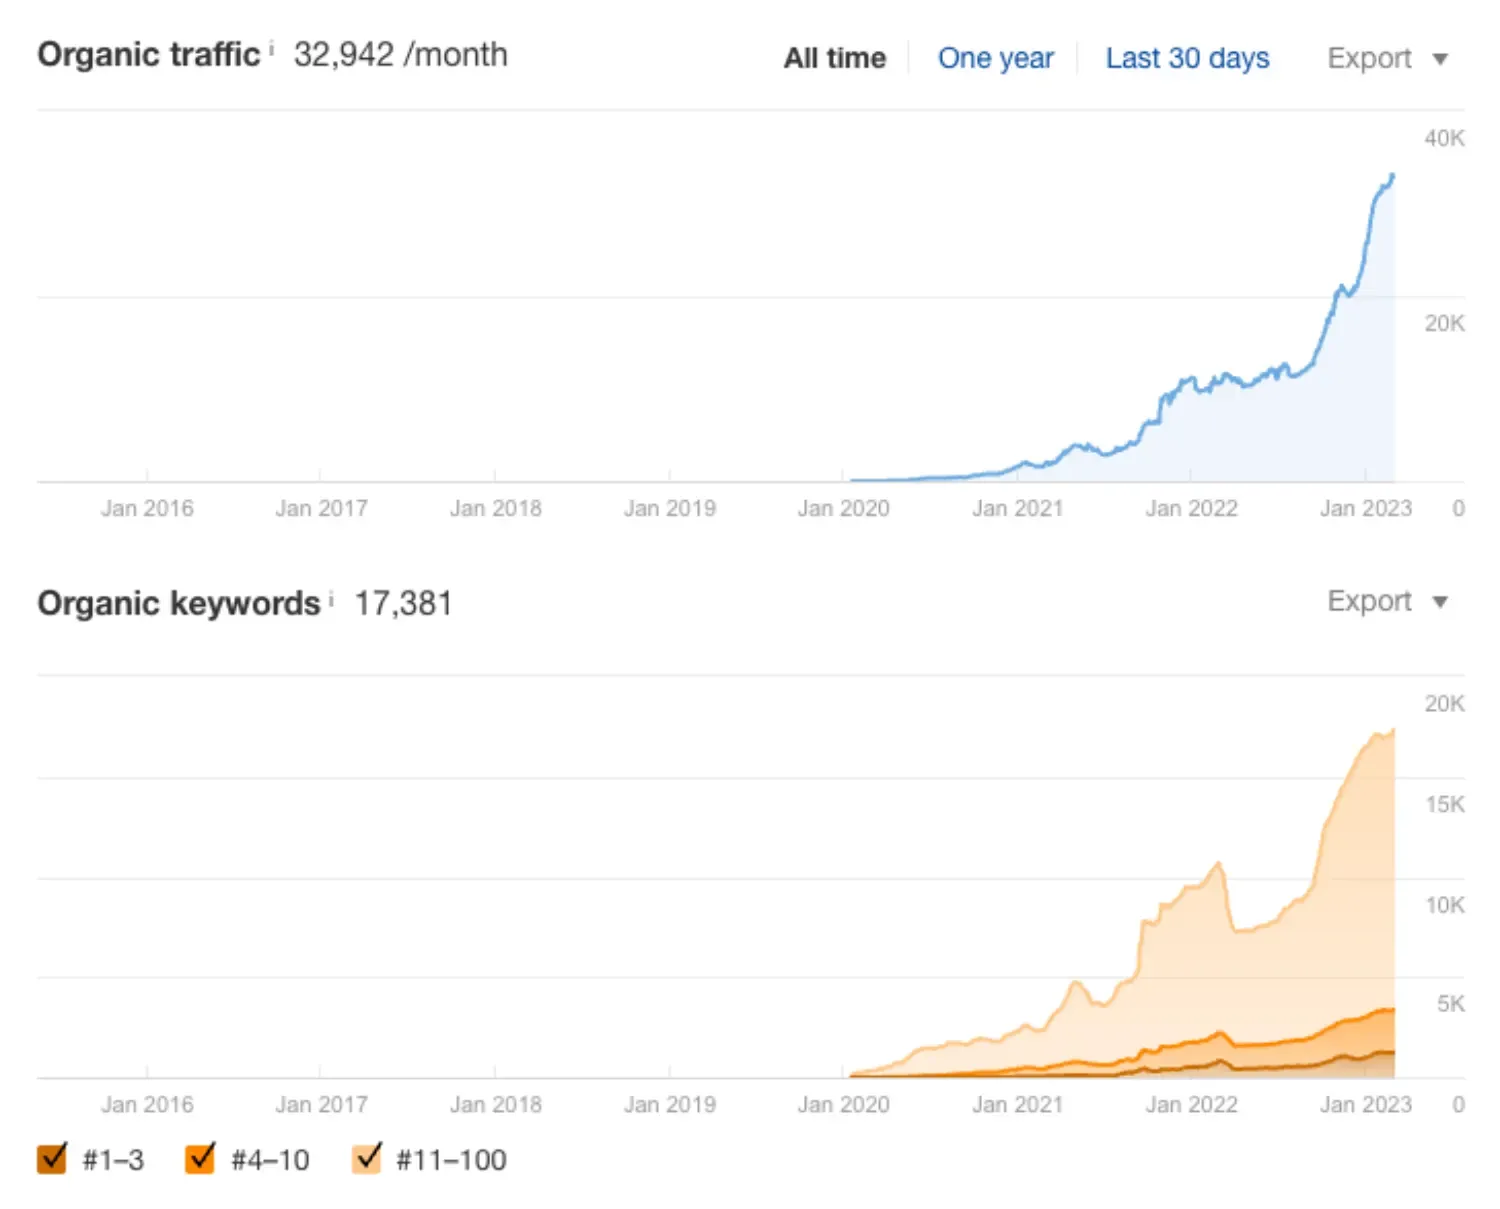
To put this into perspective, Ahrefs shows how new this website is and how huge these gains in traffic were. Keyword rankings also shows a similar trajectory of growth